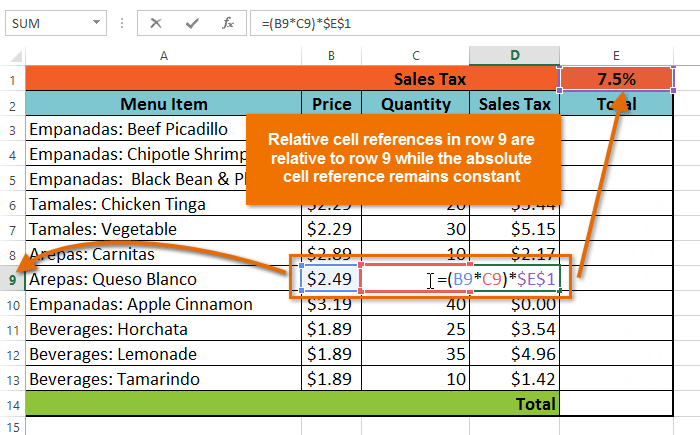
Now, dashboard skills are in a great demand by the employers. So, if you can build great dashboards; it is quite a valuable skill to have. It is even better if you can build them in one of the most widely used pieces of software – Microsoft Excel.
Most of the times, dashboards are essentially a technique of reporting, used to visually present critical metrics or some form of a data summary in order to enable quick and effective business decisions. This would happen in the same way a car dashboard will be on display and only one of the main pieces of data that are needed when driving your car. By learning the easy-to-grasp Excel formulas and functions, you will be able to lessen the burden in no time.
For more Info you can visit:- http://www.audiosolutionz.com/microsoft-excel-formulas-functions.php
There are many dashboards around, no doubt that you would have heard of Metrics Dashboard, Business Intelligence Dashboard, Operational Dashboard, and Performance Dashboard, the list can go on.
Most users usually under utilise and most of the times underestimate the power of Microsoft Excel when it comes to creating interactive and informative dashboard reports. With glowing business requirements changing at an increasing speed, the need for clarification on business performance and metrics is a strong demand. There are some really great reasons for using Microsoft Excel to build your business dashboards; the most popular reason for using Excel is its flexibility.
How many times your manager has asked for some extra items, have changed the timing of the reports and how do they look? MS-Excel can very easily accommodate all these changes and allow the users to quickly respond to the ever- changing requirements of business. This flexibility can thereby allow the users to add some extra metrics, and then add in extra charts, with replacement of graphs, and thereby changing the emphasis by font size and colour. Of course, as Excel being a major part of the Office Suite has allowed ease of interaction between other Office products also.
Excel can also handle a number of complex statistical calculations, among which many are in-built as Functions that can then be displayed without difficulty on a dashboard.