


Excel is by far part of most individuals work day. However surprisingly enough, most of us struggle with it. But it isn’t something that can’t be mastered. Smarter men & women have created reams of productivity hacks in excel which can help you do your job better. Here is a collection of some tops tips & tricks to make you ‘Excel’ – pardon the pun 🙂
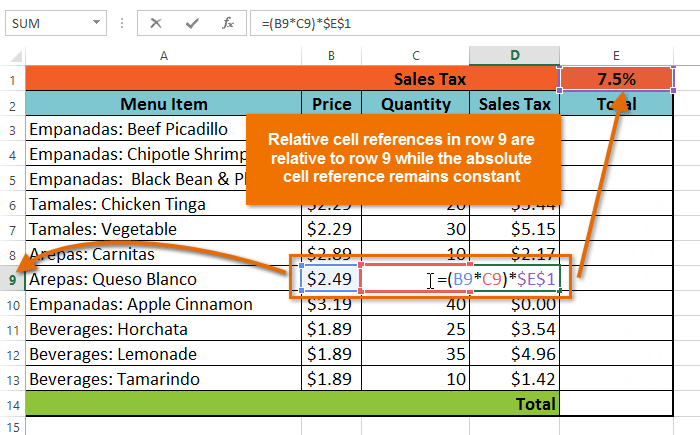
What is Absolute Cell Reference in Excel
An ‘absolute reference’ or ‘absolute cell reference’ is a spreadsheet (excel) cell that remains the same irrespective of where & how it is used – either moved or copied. Hence this is an important function that excel users need to grasp. Why would you need to use this function? …. read more

4 Excel Techniques To Boost Your Data Productivity
Here are four tips to help you create pivot tables, sort and rank data, and update the date and time in a worksheet automatically: 1. Create a Pivot Table to sort data. 2. Use SUMIF for a more concise IF statement. 3. Rank your data without sorting it……. read more

Master Excel Functions To Boost Your Data Analysis
Microsoft Excel is a powerful tool for compiling and analyzing large quantities of data. But are you intimidated by its complexity? You don’t need to be a master programmer to master Excel functions. Just endure the small amount of time it takes to learn some advanced features and reap the rewards! ……. read more
2 Visual Tricks To Bring Your Excel Data To Life
Sure, you spend a lot of time collecting, reporting and analyzing data. And you want to showcase the hard work you have done. But if you really want your data to make sense and spur action, consider representing it visually. Make excel data visually interesting through charts & graphs. ….. read more