- Home
- Courses
- Data Science
- Data Science Essentials & Machine Learning
Curriculum
- 8 Sections
- 69 Lessons
- 4 Weeks
Expand all sectionsCollapse all sections
- Before You StartIntroduction4
- Module 1: Introduction to Data Science12
- 3.1Principles of Data Science – Data Analytic Thinking
- 3.2Principles of Data Science – The Data Science Process
- 3.3Further Reading
- 3.4Data Science Technologies – Introduction to Data Science Technologies
- 3.5Data Science Technologies – An Overview of Data Science Technologies
- 3.6Data Science Technologies – Azure Machine Learning Learning Studio
- 3.7Data Science Technologies – Using Code in Azure ML
- 3.8Data Science Technologies – Jupyter Notebooks
- 3.9Data Science Technologies – Creating a Machine Learning Model
- 3.10Data Science Technologies – Further Reading
- 3.11Lab Instructions
- 3.12Lab Verification
- Module 2: Probability & Statistics for Data Science21
- 4.1Probability and Random Variables – Overview of Probability and Random Variables
- 4.2Probability and Random Variables – Introduction to Probability
- 4.3Probability and Random Variables – Discrete Random Variables
- 4.4Probability and Random Variables – Discrete Probability Distributions
- 4.5Probability and Random Variables – Binomial Distribution Examples
- 4.6Probability and Random Variables – Poisson Distributions
- 4.7Probability and Random Variables – Continuous Probability Distributions
- 4.8Probability and Random Variables – Cumulative Distribution Functions
- 4.9Probability and Random Variables – Central Limit Theorem
- 4.10Probability & Random Variables – Further Reading
- 4.11Introduction to Statistics – Overview of Statistics
- 4.12Introduction to Statistics – Descriptive Statistics
- 4.13Introduction to Statistics – Summary Statistics
- 4.14Introduction to Statistics – Demo: Viewing Summary Statistics
- 4.15Introduction to Statistics – Z-Scores
- 4.16Introduction to Statistics – Correlation
- 4.17Introduction to Statistics – Demo: Viewing Correlation
- 4.18Introduction to Statistics – Simpson’s Paradox
- 4.19Introduction to Statistics – Further Reading
- 4.20Introduction to Statistics – Lab Instructions
- 4.21Introduction to Statistics – Lab Verification
- Module 3: Simulation & Hypothesis Testing16
- 5.1Simulation – Introduction to Simulation
- 5.2Simulation – Start
- 5.3Lab
- 5.4Simulation – Demo: Performing a Simulation
- 5.5Simulation – Further Reading
- 5.6Hypothesis Testing – Overview
- 5.7Hypothesis Testing – Introduction
- 5.8Hypothesis Testing – Z-Tests, T-Tests, and Other Tests
- 5.9Hypothesis Testing – Test Examples
- 5.10Hypothesis Testing – Type 1 and Type 2 Errors
- 5.11Hypothesis Testing – Confidence Intervals
- 5.12Hypothesis Testing – Demo with R & Python
- 5.13Hypothesis Testing – Misconceptions
- 5.14Hypothesis Testing – Further Reading
- 5.15Hypothesis Testing – Lab Instructions
- 5.16Hypothesis Testing – Lab Verification
- Module 4: Exploring & Visualizing Data4
- Module 5: Data Cleansing & Manipulation4
- Module 6: Introduction to Machine Learning4
- Final Exam & Survey4
Introduction to Statistics – Summary Statistics
Summary Statistics
Downloads and transcripts
Video Transcript
- Start of transcript. Skip to the end.
- So we just discussed visual ways to summarize data,
- now let’s discuss numerical ways to summarize data.
- So, I’ll present some summary statistics
- starting with the sample mean.
- So, the sample mean is just the average of the data points you
- have, and you shouldn’t confuse x-bar with mu.
- Usually, mu is the mean of the whole distribution,
- whereas x-bar is just the average of the points
- that we draw from the distribution.
- So just be careful, because everything in these slides
- are quantities that we compute from a sample of the data,
- they’re not the computations that we would
- do if we had the underlying population or the PDF.
- So, as long as the sample’s large enough though,
- as long as the n is large enough, then x-bar is very,
- very similar to mu, the population mean.
- So that’s called the sample mean.
- And then quantiles and
- percentiles are also useful summary statistics.
- And to compute those, you’d order the data, and
- then you find which data point is the one that divides
- the data into two parts, where a fraction p of
- the data values are less than or equal to this guy, and
- the remaining fraction are greater than that guy.
- Okay, so just to graphically put it out, so
- you put the data points in order from lowest to largest.
- And then you find the point, let’s say you’re looking for
- the 0.55 quantile or the 55th percentile, you look for
- the point where 55% of the data are below it and
- the other 45% are above it.
- And that’s your point, that’s that quantile, okay?
- And then the sample median is just the middle data point.
- It’s also, you can use the definition of quantiles and
- percentiles to get to it because it’s on the 50th percentile or
- the quantile 0.5.
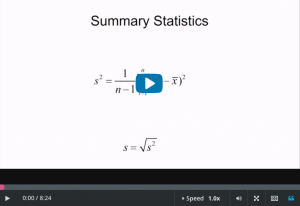
- Now, I’ve put up the formula for the sample variance here, and
- there’s something strange going on here.
- So this part you would expect, right?
- This looks very similar to the definition of the population
- variance.
- You take each point, you subtract something like a mean,
- and you square it and you add it up.
- But you’d think this would be a 1/n here, wouldn’t you?
- But, surprise, it’s n-1.
- So what is that n-1 doing there?
- And the reason for this is actually very technical,
- it has to do with something called bias.
- If we put a 1/n there, the sample variance would be what’s
- called a biased estimator of the true population variance.
- But you shouldn’t worry about this, but
- let the software do it for you.
- Every piece of software that I have ever used has had a command
- to compute the sample variance.
- You just give it the data, and you ask it for the variance, and
- it will give you, it will remember this 1/n-1 to give you
- the sample variance so that you don’t have to remember it.
- And then luckily, the sample standard deviation is the same,
- it’s just the square root of the sample variance.
- I have 500 points, they’re in this giant vector,
- which I didn’t feel like writing the whole thing out.
- And I decided to make a histogram.
- So I type my histogram command, and this is what I got.
- And now, I just want to summarize the important bits.
- I don’t wanna preserve all of this detail in here which I
- don’t necessarily need.
- So one thing I could look at is the five number summary.
- Let me break down for you what this five number summary is.
- The range is the distance between the minimum and
- the maximum.
- No surprise.
- The interquartile range is the distance between
- the first quartile, which is the 25th percentile,
- and then the 75th percentile, which is the third quartile.
- Now that you know how to compute percentiles,
- you can compute these things.
- Okay, so the five number summary is actually the smallest value,
- and the largest value, the median, which is Q2,
- here the median, and then Q1 and Q3,
- which are the 25th percentile and the 75th percentile.
- So once you’ve got that,
- that tells you a lot about the distribution.
- So the five number summary is this collection of five values,
- it’s the minimum and the maximum.
- The median, which is the 50th percentile.
- And then Q1 and Q3, which are the 25th percentile and
- the 75th percentile.
- So it’s a nice simple way to characterize the distribution.
- Now, back to the visualizations.
- A box plot is a great visual way to represent a distribution,
- it has less information than the full distribution.
- This is the histogram, the full distribution.
- Here’s the box plot.
- And it just conveys a summary of information.
- Now, you can see that the center is the same, right, instead of,
- the middle is about at 4, and so that’s where the median is.
- This is the median over here.
- And if I’m okay with summarizing a probability distribution
- like this, then I can get away with plotting many
- distributions succinctly on the same page.
- Cuz it’s much easier to plot 50 of these things next to each
- other than 50 of those things.
- It’s just visually easier for humans to understand.
- But how to get from the distribution to the box plot is
- a little bit weird, so let me tell you about that.
- Okay, so first, the middle bit is the median,
- as I mentioned, it’s not the mean, it’s the median.
- And strangely enough,
- the mean usually doesn’t get marked on a box plot.
- I’m not sure why not.
- Some people mark it on there, which I think is a good idea.
- But just because I think it’s a good idea doesn’t mean that
- people who write visualization software think it’s a good idea.
- But in any case, that is the median.
- And then the first quartile is marked and
- the third quartile is marked.
- This main box just tells you where the quartiles are.
- By the way, don’t get the word quartile mixed up with quantile.
- There are only four quartiles.
- Quartiles sounds like quarter, okay?
- But there’s an arbitrary number of quantiles.
- And then, the whiskers are more complicated.
- So this point here is actually,
- you take the inter-quartile range, which is Q3 minus Q1,
- you multiply that by 1.5 and you add it to Q3.
- Okay, so it’s Q3 + 1.5 times the inter-quartile range,
- which is Q3 minus Q1.
- And then you go, you find the point,
- the data point, the point that’s actually in your data
- that is slightly below that, okay?
- It’s a very weird set of instructions,
- but that’s what it is.
- They want these whiskers to be exactly at a data point.
- So they have you go up 1.5 times the IQR, and
- then down to the nearest data point.
- And then this bottom one,
- analogously is the data point just above 1.5
- times the IQR below the first quartile.
- Okay, and then the other, and
- any other point outside the whiskers get marked with a plus.
- So the five number summary is here.
- One, two, three, four, and five.
- So you’ve got the min and the max marked.
- Also, the first, second, and third quartiles.
- And the nice thing about these box plots, as I mentioned, is
- that you can visually understand the distribution very quickly.
- You don’t need all the little wiggles in the histogram
- to understand what’s going on.
- And yet, you can still pack several box plots into a figure
- to have many of them on the same screen because they’re so
- compact.
- End of transcript. Skip to the start.